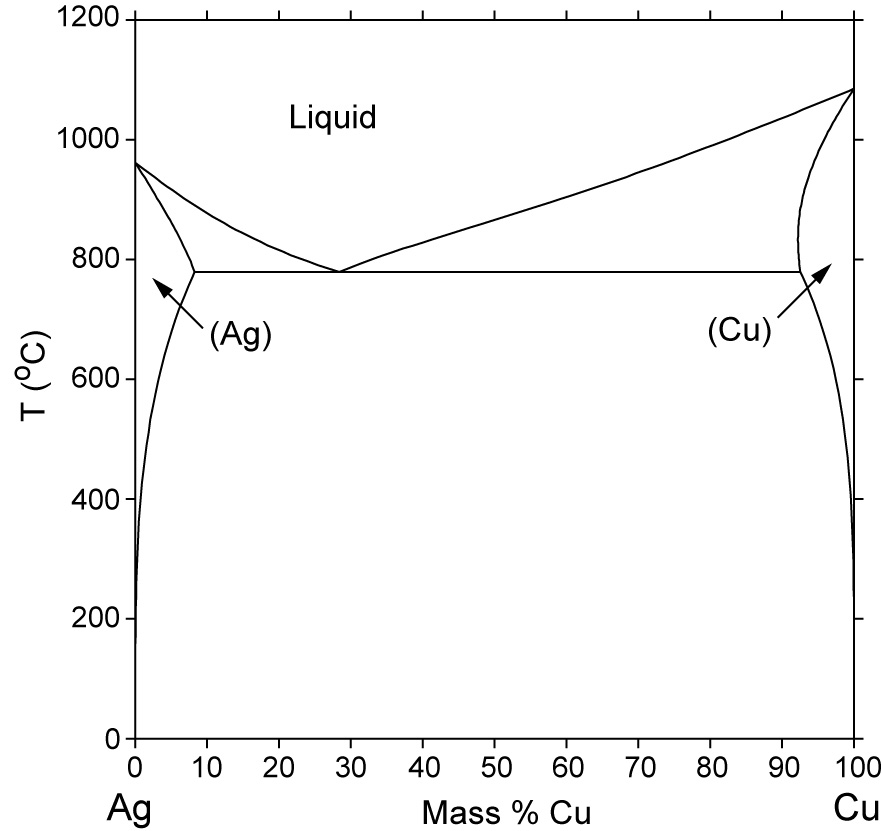
The largest area shows where the alloys are solid, and the uppermost
area shows where they are liquid. The areas between represent
semi-solid states.
What do the remain two areas (on the left and right edges)
represent?
About the semi-solid states: Is this the cause of the surface
texture that sometimes occurs in eutectic soldering? Is the graph
saying that it is (nearly) impossible to keep the adjacent areas
smooth?
Janet, The areas on the right and left of that diagram represent the
single phase solid areas in the Ag Cu system. What that means is at
the ratios and temperatures shown the alloy formed is a single phase
solid solution. The reading of phase diagrams is a fairly complex
subject and is not one to be condensed to a single email response
but if you want to get a good basic introduction to reading phase
diagrams go to http://www.soton.ac.uk/~pasr1/ it is a first year
intro to phase diagrams.
On the AgCu diagram you will notice that at 92.5% silver 7.5% copper
alloy (sterling) that a single phase state can be achieved by
heating to 732C. If you then quench it rapidly enough it will retain
the single phase state and be at its most soft and ductile state.
When you have multiple phases present the metal will not be as soft
This is what you want to do before the precipitation hardening
process Peter mentioned. This is called solution treatment and for
maximum precipitation hardness you must get all the solute (the
copper in this case) to be dissolved in the solvent (the silver) so
that when you start the aging process the solute will precipitate
out of the solution in a uniform fashion. If you do not get the
copper all into solution you will have a multiple phase alloy that
will not allow the solute to precipitate out.